1. Hazard assessment of storm surges
The hazard level of storm surge inundation is assessed by estimating the seawater inflow due to storm surges into the target assessment area and the depth of inundation and other factors which are used as indices of damage. When estimating the seawater inflow due to storm surges, the tide level and the overtopping wave discharge at the coastal levee need to be determined. The overtopping wave discharge should be calculated from the tide level and wave height, but is not assessed stochastically at present because the tide level and wave height are not independent phenomena.
A new method was therefore developed as shown in the flowchart below. With this method, a probability typhoon model is built based on the attributes (center position, central pressure, moving velocity, moving direction, and radius) of typhoons which visited Japan during the past several decades; typhoons are simulated for a period sufficiently long for conducting statistical analysis of extreme values; the maximum tide level and overtopping wave discharge during the respective typhoons are calculated; and based on the results, the reproduced period of the tide level and overtopping wave discharge is assessed. According to the theory of this model, typhoons change based on random numbers according to a normal distribution of the mean values and standard deviation of the typhoon attributes for each 2 grating and their temporal variation obtained by calculations.
Building of a probability typhoon model

Typhoon simulation and tide level and overtopping wave discharge calculation for a long period

Statistical analysis of extreme values of tide levels and overtopping wave discharge
Flowchart of the probability assessment of tide levels and overtopping wave discharge
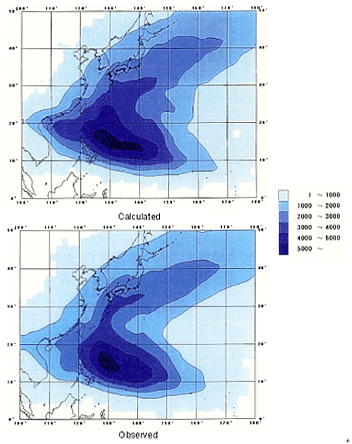
The figure below compares the frequency of passage of typhoons obtained by actual observation with that obtained by typhoon simulation covering 47 years at a time and conducted 50 times in total. The results of observation and simulation showed good agreement. Favorable agreement was also obtained for the mean values of central pressure and moving velocity of typhoons, confirming that typhoon simulation with satisfactory precision is feasible with this method.
 Frequency of typhoon passage
(upper diagram: calculated, lower diagram: observed)
Using our probability typhoon model, a typhoon simulation covering 2,000 years was conducted; the tide level deviation, tide level, waves, and overtopping wave discharge in time series were calculated for each typhoon; and the reproduced period of the tide level deviation, tide level, waves, and overtopping wave discharge was assessed based on a statistical analysis of extreme values using the values obtained. As for the overtopping waves due to atmospheric low pressure, a probability low pressure model was built based on analysis of past low pressure records, based on which an assessment was conducted in the same manner.
For further details of this research, see the references below:
Kato et al. (2003), Probability Assessment of the Tide Level and Overtopping Wave Discharge using a Probability Typhoon Model, Coastal Engineering, JSCE, Vol. 50, pp. 291-295.
Kato and Torii (2003), Inundation Hazard Assessment for Drawing Up a Storm Surge Hazard Map, Civil Engineering References (Journal of PWRC), Vol. 45, No. 7, pp. 18-23.
Kato et al. (2004), Probability Assessment of Overtopping Wave Discharge using a Probability Low Pressure Model, Civil Engineering in the Ocean, JSCE, Vol. 20, pp. 95-100.